
Using the Stream Status Page with Sardius Stream
Updated
The Stream Status page is a section located under the "Stream" tab on the side bar of a channel's event calendar. This status page provides real time analytics for a channel's event. This page includes seven main portions: Preview player, Preview Stream, Public Stream, Channel Outputs, Calendar Event Lifecycle, Stream Analytics, and Encoder Status.
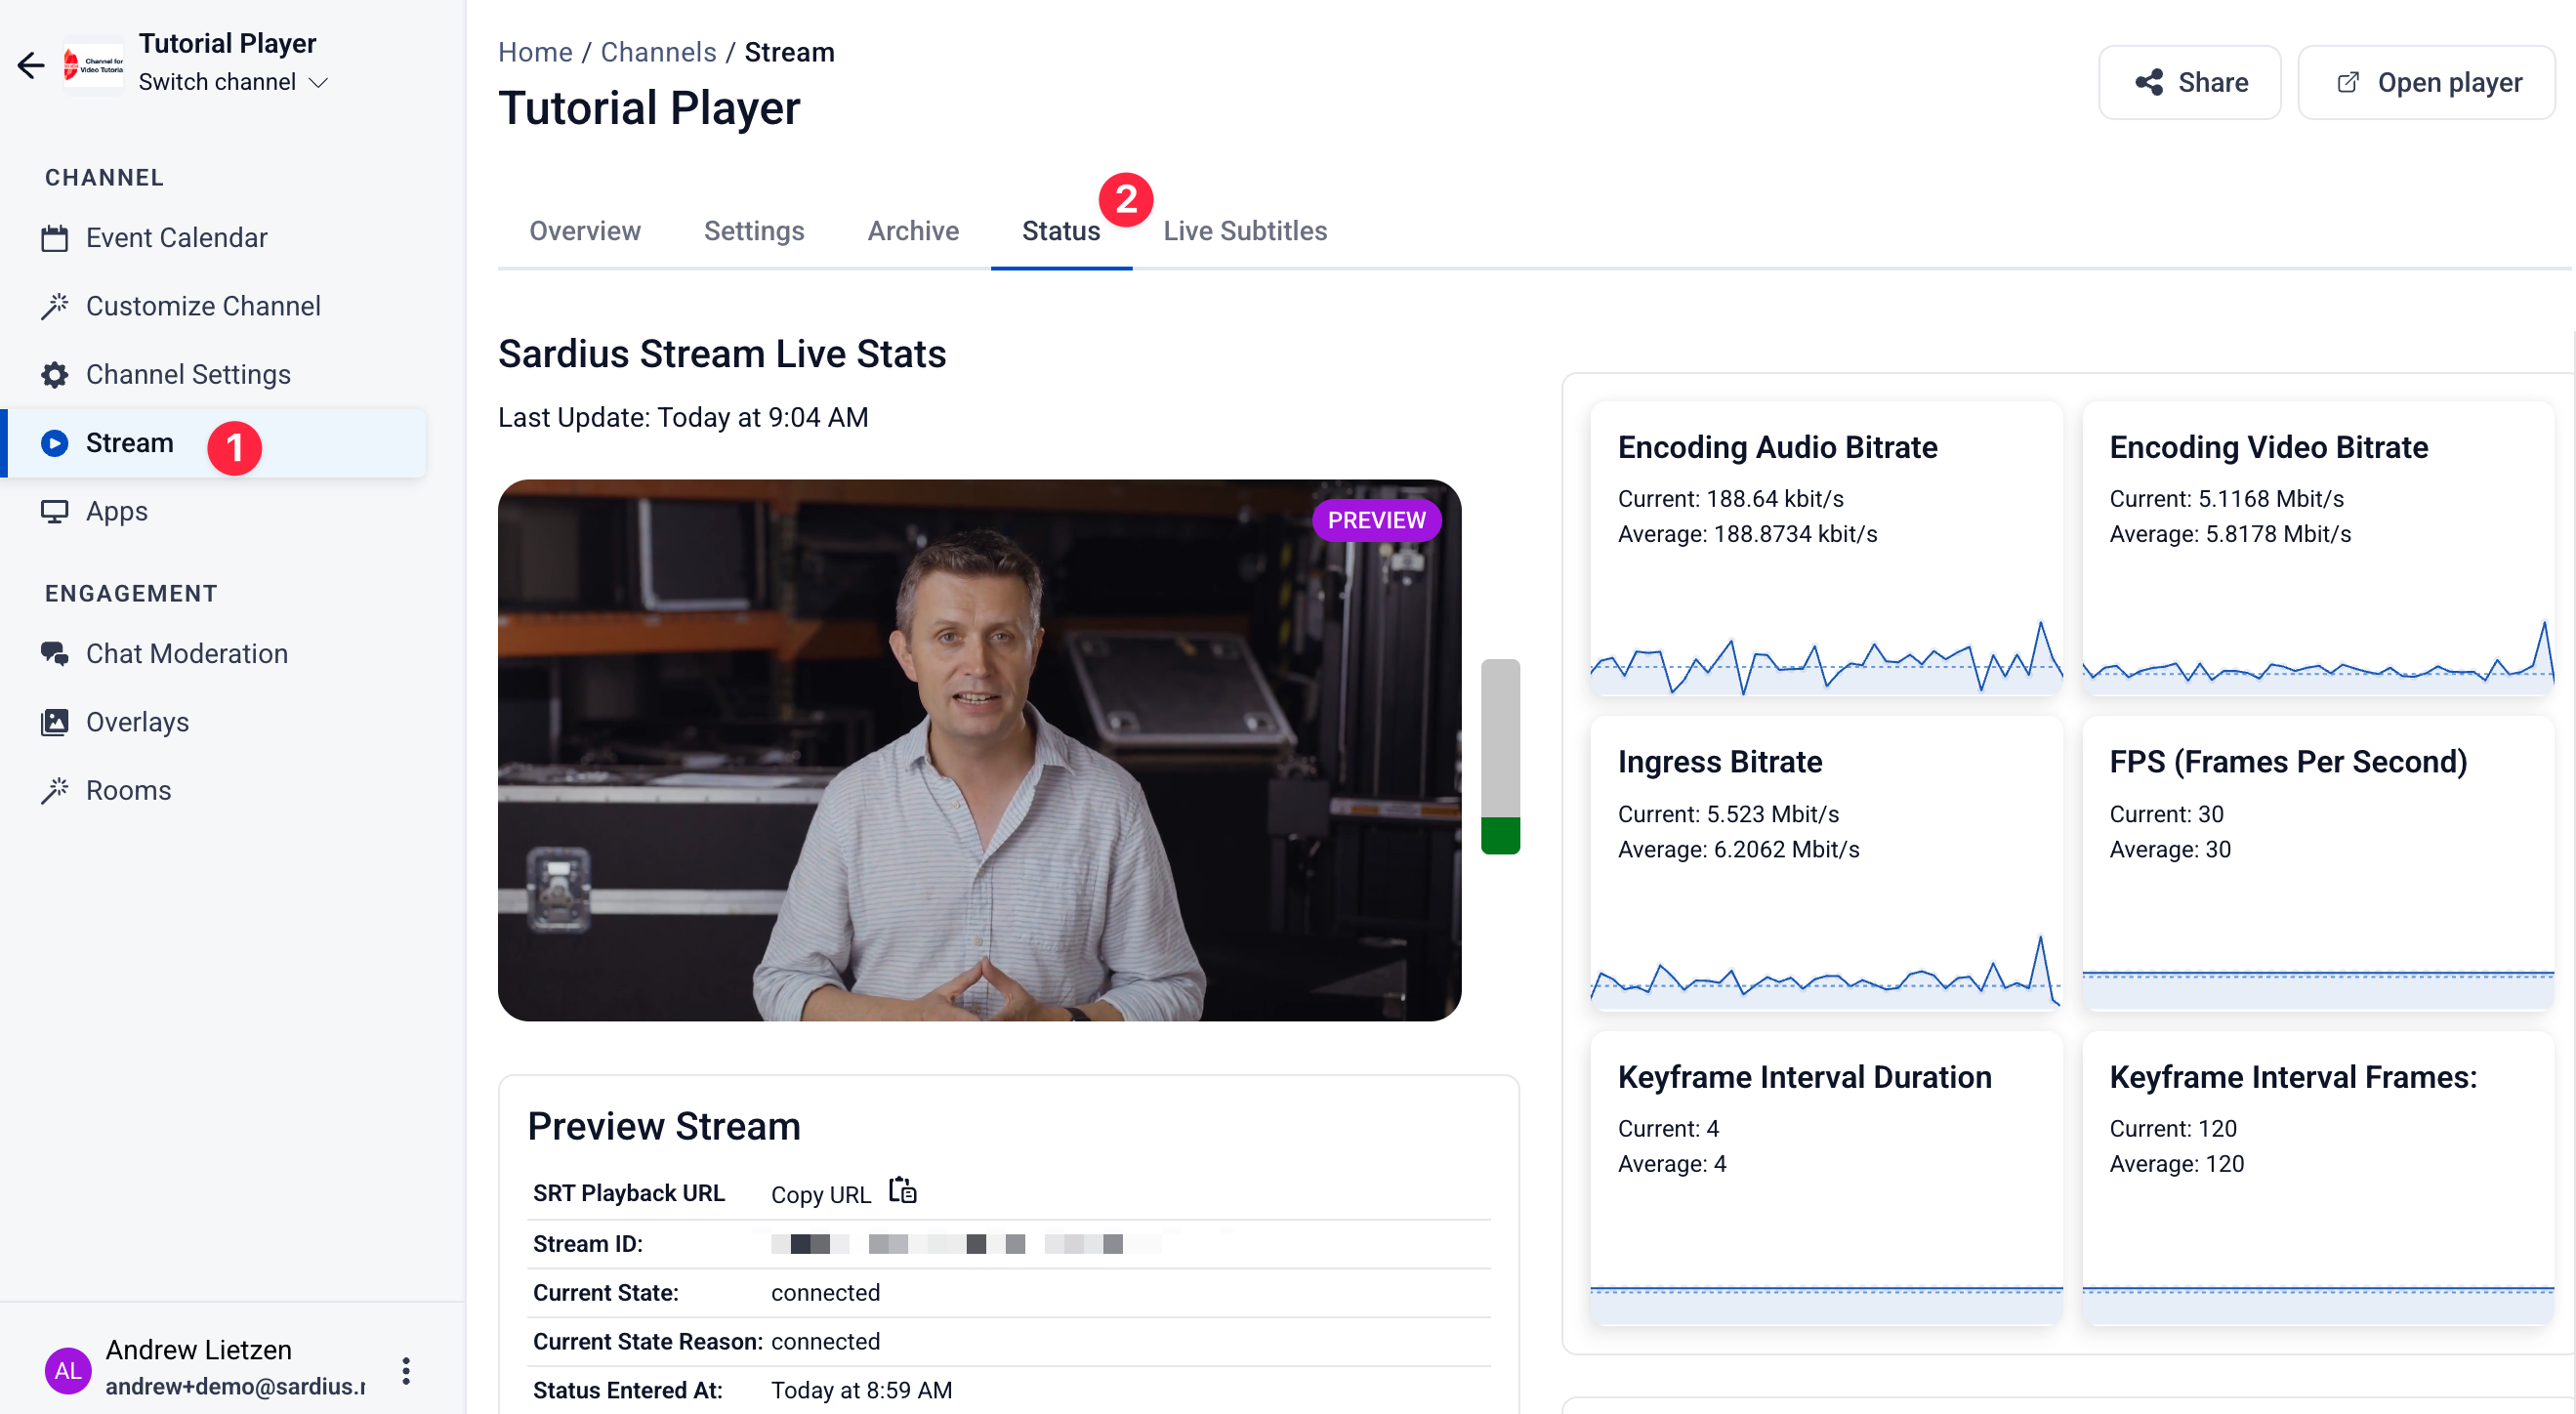
Stream Status Features
Preview Player
This player is used to see confirmation of your event's Audio and Video segments.
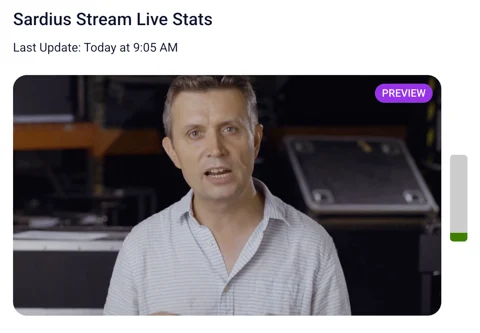
How the Player helps:
This is your quickest and easiest visual check of a stream’s health.
- Is it playing cleanly? We know then that the signal is making it all the way through to the channel successfully.
- Is the player Black or Frozen? This is a good indication that the channel is not receiving data correctly and likely points to a problem further upstream.
- Is the player buffering? Buffering indicates that some but not all data sections are being received to the channel. This is most typically caused by latency issue within the channel settings or settings within the encoder.
Stream Analytics
The graphs within this section display real-time performance metrics for a channel.
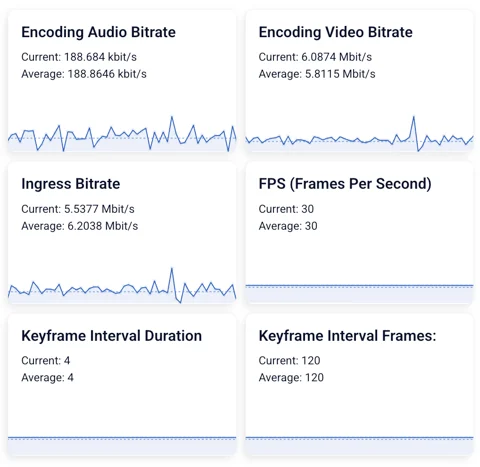
This is where any quality issues can be diagnosed once the stream is confirmed as successfully connected to your channel.
What does all this data mean?
- Encoding Audio Bitrate — real-time metric showing how many kilobits per second of audio data the encoder is currently sending. Healthy values are typically 96, 128, or 192 kbps.
- Encoding Video Bitrate — real-time metric showing the amount of megabits per second of video data being sent by the encoder.
- Ingress Bitrate — the total incoming data rate (audio + video combined) hitting the Sardius platform from the encoder at the point of entry.
- FPS (Frames Per Second) — the number of digital frames being sent from the encoder every second. Should match what the event's template expects (commonly 24, 25, 29.97, 30, 59.94, or 60).
- Keyframe Interval Duration — how often (in seconds) the encoder sends a full, standalone reference frame ("Keyframe"). Also known as GOP.
- Keyframe Interval Frames — the same setting expressed as a frame count instead of time. Keyframe Interval Frames = Keyframe Interval Duration (seconds) × Frame Rate (FPS).
How do I diagnose an issue?
- Choppy or dropping audio → check Encoding Audio Bitrate against the expected value and watch for dips (dips = encoder dropouts).
-If the value and graph remain a flat/ consistent number, this is a clear sign your channel is not receiving audio segments. This problem often lies at the source level not within the Control Panel.
Stuttering or frozen video → check FPS against the expected frame rate, and Encoding Video Bitrate for dips.
-If the value and graph remain a flat/ consistent number, this would indicate your channel is not receiving Video segments and will need to be addressed at the Source or Encoder level. - Player freezing/resuming, or audio and video drifting out of sync → check Keyframe Interval Duration/Frames; a GOP interval under 2 seconds is often a clear indication
General connection health → check Ingress Bitrate; a flat-lined reading with only rare blips usually means the stream has effectively stalled upstream. This is usually caused by a Network interruption upstream. Check your encoder and system’s internet connection.
Preview Stream
This section provides basic API information regarding the event running.
This is the truest read of whether Sardius is actually receiving signal from the encoder, independent of whether the event looks "live" anywhere else, ie the Event Calendar. This is usually the first place to look when checking if a stream is live or an encoder is connected to your channel
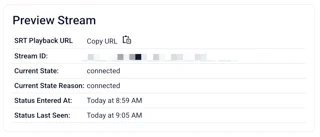
Each part breaks down like this:
- SRT Playback URL — the raw SRT connection, being sent to the Sardius Control Panel.
- Current State — the state of the encoder/stream. Will either be connected or disconnected. Disconnected can usually be tied to an offline encoder or a connection that is not configured correctly.
- Current State Reason — gives a description of the Current State status. If Current State is registering as offline, this section will give the specific explanation as to why — e.g. "encoder offline," "connection timeout," or "client disconnected."
- Status Entered at — this is the time at which the encoder connection was established. For automated streams, this is approximately two minutes prior to event start, during the encoder's "spin up" phase.
- Status Last Seen — this is the timecode for when the Control Panel last checked the stream's connection. This is a frequent check to ensure that the data being pulled into the Control Panel is active and healthy.
Public Stream
This section possess basic information regarding the public-facing, or viewable stream, present in the Sardius Player. This is the layer that decides whether the stream is publicly accessible.
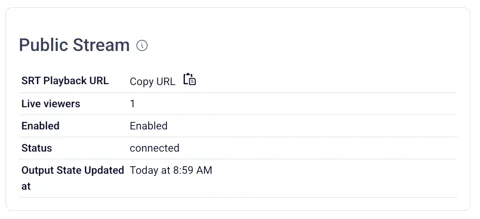
What do these pieces represent?
- SRT Playback URL — a raw SRT connection that can be sent to a decoder.
- Live Viewers — the number of active people currently watching the public stream.
- Enabled — whether the Public Stream is enabled or disabled.
- Status — whether the Public Stream is connected or disconnected, directly tied to Enabled.
- Output State Updated at — the last time the Control Panel logged a change or check-in on that output's state.
Channel Outputs
This area is a list and visual representations of the outputs enabled on the stream (e.g. Facebook, YouTube, RTMP connections). This section can be used to rule out whether a problem is actually with the stream itself, or just one destination it's being pushed to.
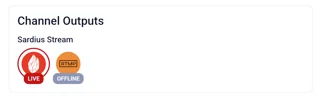
Each output reports its own status (Live, Offline, Connecting, or Error) independently of the main Stream. Each output works separate of each other and can be set up in numerous different ways. See Adding an Output.
Outputs can be selected in this section of the Stream Status Page for an overview of the output. This overview includes the Type of Output, Stream URL, and Stream key; as well as the Status and State of the connection.
Outputs can be stopped or started within the Overview by selecting the desired button. Events connected to Social Media platforms like Youtube and Facebook can be also be ended directly within this screen
Calendar Event Lifecycle
This section Includes information about the stream's duration and current status during that streaming cycle.
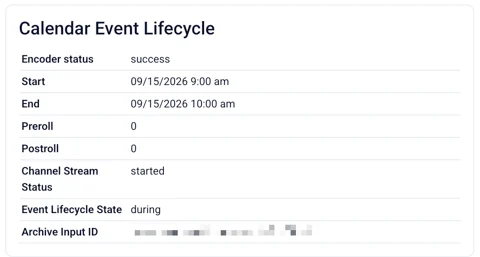
What each part means:
- Encoder Status - indicates whether the encoder successfully connected to the Sardius Control Panel
- Start/End - the time and date an event is set to begin and finish streaming
- Pre/Post Roll — whether the event has a countdown screen (Pre-Roll) before it starts or a hold screen (Post-Roll) after it ends. If a client reports the stream "isn't live yet," check whether the event is still inside its Pre-Roll window before assuming there's a problem.
- Channel Stream Status — indicates whether the channel stream has started / is showing live.
- Event Lifecycle State — indicates at what point in its duration the stream is: starting, during, or stopping.
- Archive Input ID (PID) — the identifier tying this specific event to its recording once it's archived into Assets. This is the thread connecting a live event to its archived VOD copy
Encoder Status
Encoder Status provides real-time analytics into the function and load being put on the encoder itself — separate from the stream's video/audio metrics above. These fields instead reflect the health of the physical (or virtual) encoder hardware itself
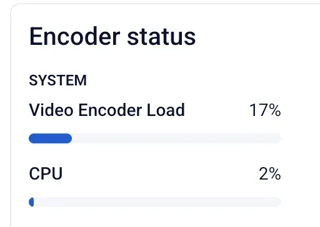
What do these fields mean?
- System Utilized — the overall gauge of the encoder's system load. This bar is a collective representation of the work load effect of CPU, Memory, playback and data-collection artifacts. This gauge fluctuates based on the amount of work required at any given second.
- CPU — percentage of processor load the encoder is currently using.
- Memory — percentage of RAM currently in use on the encoder.
How does effect my stream?
This section is about the hardware, not the content. High values here point toward the encoder itself struggling. An encoder under extreme load can cause subsequent problems with streaming.
If an issue is observed here, it is advisable to restart your encoder or contact support for further diagnosis.
What to look out for:
- Sustained high CPU (consistently near 100%, not just a brief spike) is a strong signal of real strain being placed on the hardware itself.
- Memory approaching/ is Full- in general this gauge should remain with space on it. If the gauge is high or full this usually means one thing; old channel connections are stuck connected or abandoned on the encoder.
Further analysis into your device’s health connections and activity can also be found in Diagnostics Tab, located under the device’s details.
Troubleshooting: Where to Look?
- Preview Player. Quick visual check — is it playing, black, frozen, or buffering?
- Current State + Current State Reason (Preview Stream). Is my channel receiving an active connection? If not, why?
- Status Last Seen vs. the current time. Is the Status Last Seen recent? Within the last couple of minutes, trust the reading. If the timestamp is older, try refreshing the Status Page before troubleshooting further.
- Public Stream. Do I want this to be viewable to the public? If so, ensure this feature is toggled on.
- Channel Outputs. Rule in/out whether the issue is isolated to one destination (Facebook, YouTube, etc.) rather than the core stream. If an output is showing as offline or needs to be started/stopped, you can do so here.
- Calendar Event Lifecycle. Confirms the event is actually in its live window, not still in Pre-Roll/ Post-Roll or has already ended.
Stream Analytics. Diagnoses the specific quality symptoms (audio, video, sync, or overall signal health). Once you know the stream is genuinely connected, use these to help pinpoint where the issue is. - Encoder Status. Last stop — only relevant once everything above points to the hardware itself rather than a network or configuration issue.