Understanding the Usage Page
Updated
The Usage Analytics page gives you a real-time snapshot of your account's resource consumption — from storage, bandwidth, and streaming minutes to AI features and viewer activity. It's the go-to place for monitoring how your account is tracking against your contracted limits throughout the year.
How to Get There
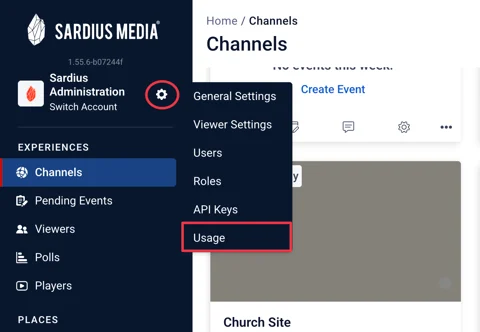
In the Control Panel, click the Settings gear next your account name → then click Usage.
Getting Started: Setting a Contracted Period
Before data displays correctly, your account needs an active contracted period configured. If one hasn't been set up yet, you'll see a notice at the top of the page. Clicking it opens a Contact Support dialog explaining that your contracted period hasn't been set or updated. From there, click Notify to send a message to your Sardius Account Manager, or Cancel to dismiss.

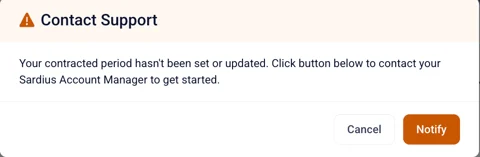
This notice simply means your account contract needs to be set up or updated. Once your contracted period is configured, usage data will be measured against the correct time window and quota thresholds.
Reading the Charts
Each usage chart plots month-by-month data for the current year and includes two standard indicators:
- Current Growth (green line) — your actual usage to date
- Growth Trend (orange dashed line) — a projection of where usage is headed at the current pace
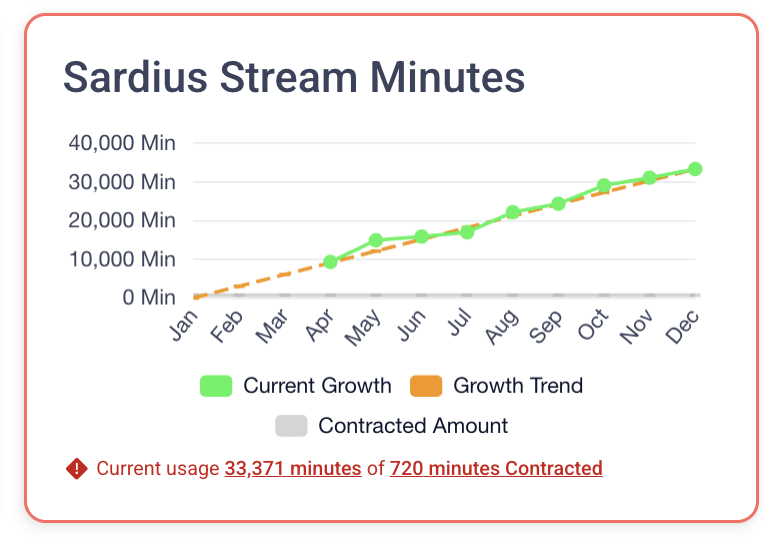
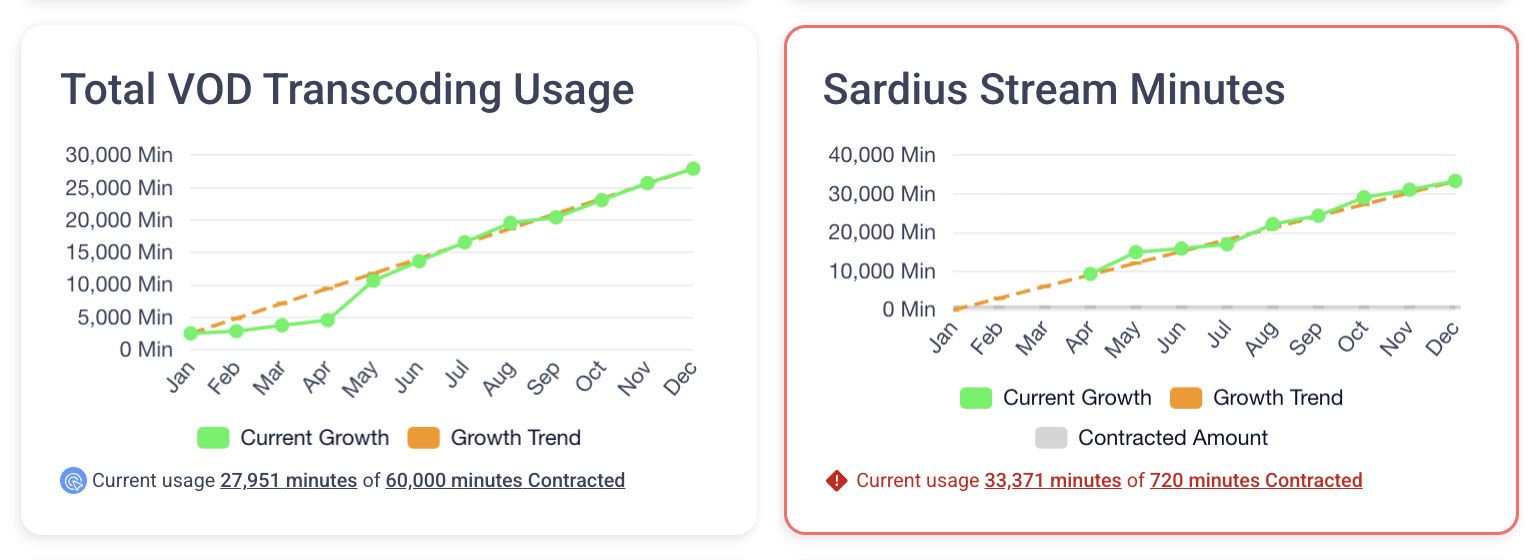
When a contracted amount is set for a metric, a third indicator — Contracted Amount (gray line) — appears on the chart, making it easy to see how your growth compares to your limit. The current usage displayed below the chart will also show both your actual figure and your contracted total (e.g., "Current usage 33,371 minutes of 720 minutes Contracted").
Over-Limit Alerts
If your usage has exceeded the contracted amount for a given metric, the panel will visually flag it: the card gets a red border, the current usage line turns red, and a warning icon appears alongside the figures. This makes it immediately obvious which areas of your account need attention. Contact your account manager if you're approaching or have exceeded a limit.
A Note on Usage Limits: Reaching or exceeding a usage limit does not cut off your access or disable any features. If your account approaches or goes over a contracted threshold, your Sardius Account Manager will be in touch to discuss your options.
Storage and Bandwidth
At the top of the page, two charts give you a clear picture of your infrastructure usage.
-
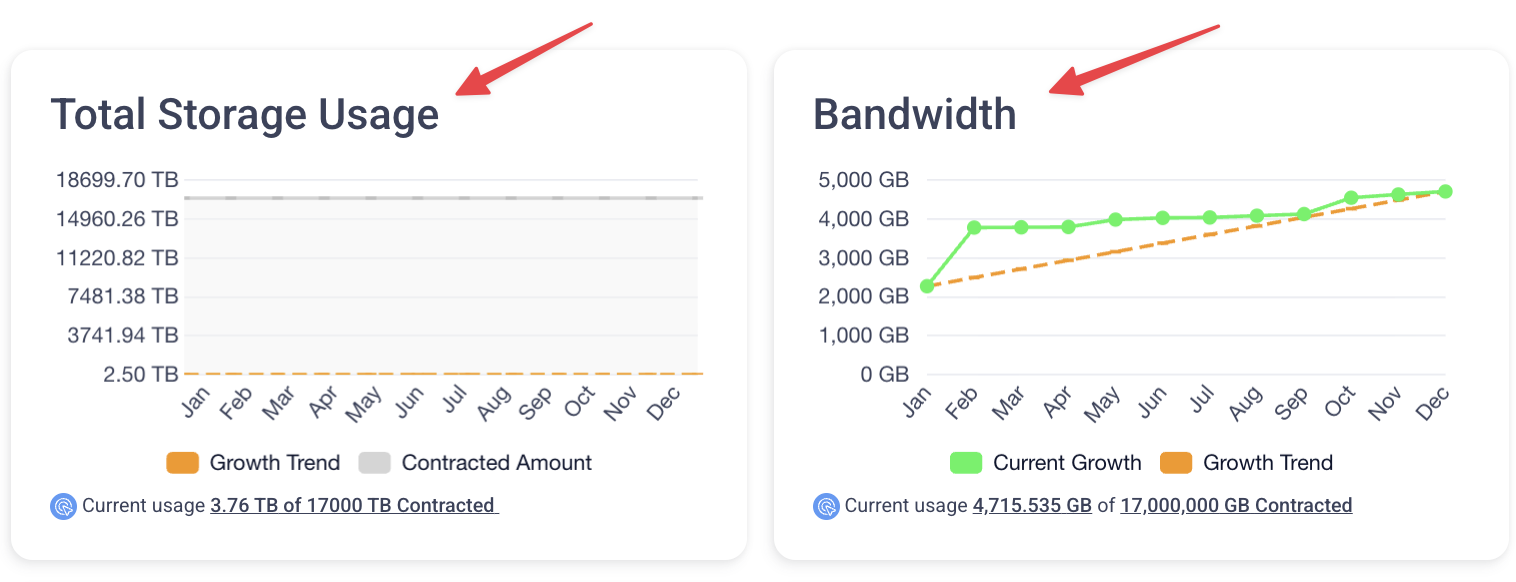
Total Storage Usage tracks VOD, Files, Audio recordings, and live stream archives - anything uploaded to SCP over the year. A dashed orange Growth Trend line projects where your usage is headed if the current pace continues.
-
Bandwidth tracks VOD and Entrypoint delivery. It uses a line chart with two indicators: Current Growth (green) shows your actual usage, while Growth Trend (orange, dashed) projects forward. Your current total for the period is displayed below each chart as a clickable figure.
Transcoding and Streaming
-
Total VOD Transcoding Usage measures the total minutes spent transcoding Video On Demand content. Like the bandwidth chart, it plots month-by-month growth with a projected trend line. This is useful for understanding your encoding workload over time.
-
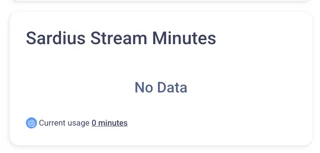
Sardius Stream Minutes tracks live streaming minutes consumed during the current contract period. If your account hasn't had any live activity yet, this panel will simply show "No Data."
Devices and Channels
-
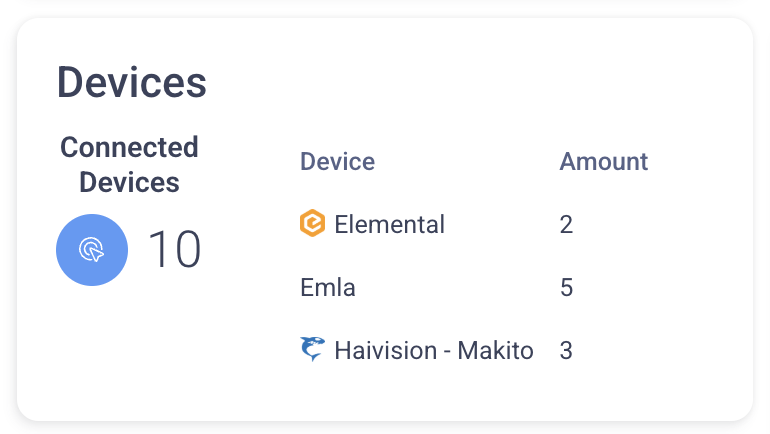
The Devices panel shows the count of connected devices registered to your account, with a table breaking down the number by device type.
-
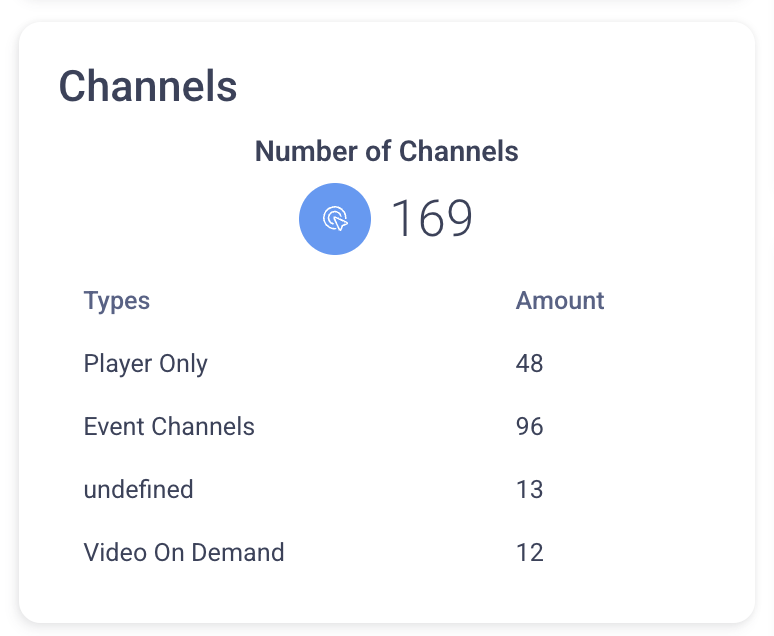
The Channels panel works similarly — it displays how many channels your account has active, categorized by channel type in a summary table.
Advanced Sim-Live and Apps
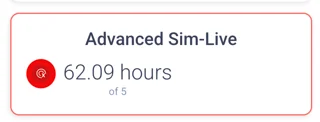
- The Advanced Sim-Live panel displays total hours consumed for the current contract period alongside the contracted amount (e.g., 62.09 hours of 5). If usage has exceeded the contracted limit, the panel will display a red border and red icon — the same over-limit treatment applied to other metrics across the page. If Advanced Sim-Live is not part of your contract, the panel will show an informational message instead. Click Learn More to contact your account manager about enabling it.
Total Assets
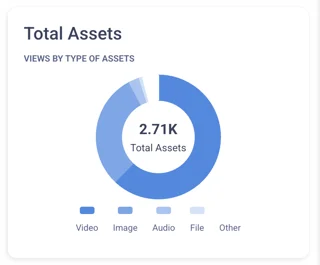
- The Total Assets panel displays a donut chart showing your full asset library broken down by type: Video, Image, Audio, and File. The center of the chart shows the total count at a glance, and each asset type is color-coded in the legend below.
AI Subtitles and Translations
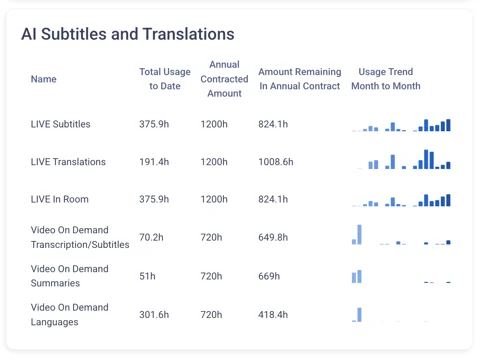
This section tracks your account's usage of Sardius AI-powered transcription and translation services. It's displayed as a table with a row for each service type:
- LIVE Subtitles
- LIVE Translations
- LIVE In Room
- Video On Demand Transcription/Subtitles
- Video On Demand Summaries
- Video On Demand Languages
- Video On Demand Transcription Bible Verses
For each active service, you'll see the Total Usage to Date, your Annual Contracted Amount, the Amount Remaining, and a Month-to-Month Usage Trend sparkline. Services that aren't included in your contract appear grayed out — click Learn More to ask your account manager about enabling them.
AI Usage
This section displays a line chart tracking how many hours of content that has been Indexed using AI Discover during your contract period. It is divided into three tabs:
-
AI Discover (Hours)
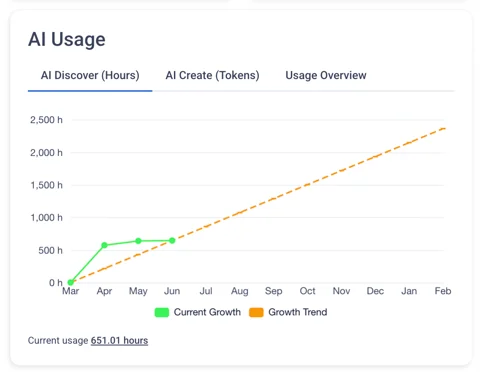
This tab displays a line chart tracking how many hours of AI Discover have been used during your contract period. The chart shows two data series:
-
Current Growth (green line) — Your actual AI Discover usage to date
-
Growth Trend (orange dashed line) — A projected trend based on your usage pattern, extending through the end of your contract period Your total current usage is displayed below the chart as a linked value (e.g., 651.01 hours).
-
-
AI Create and Curator (Tokens)
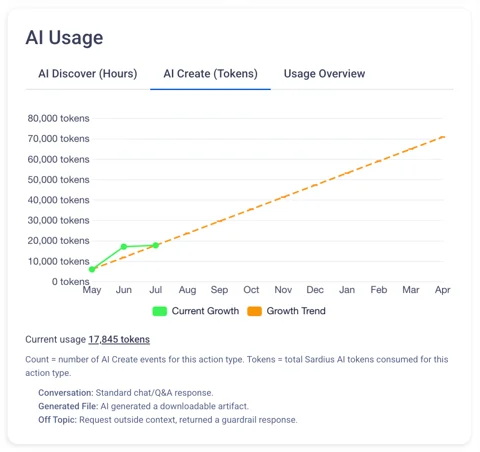
This tab displays a line chart tracking how many tokens have been consumed by AI Create during your contract period. Tokens represent the AI processing resources used each time a user interacts with AI Create. The chart uses the same two data series as AI Discover:- Current Growth (green line) — Actual token usage to date
- Growth Trend (orange dashed line) — Projected usage through the end of your contract period. Your total current usage is displayed below the chart as a linked value (e.g., 17,845 tokens).
-
Usage Overview
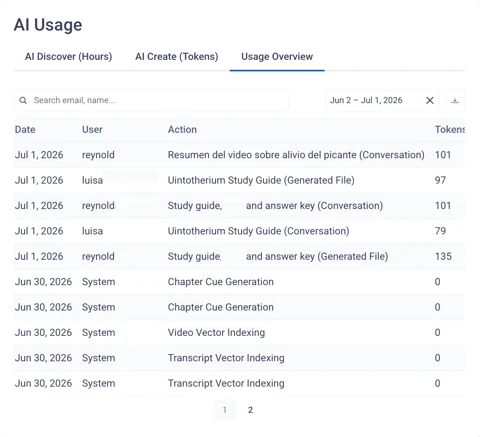
The Usage Overview tab provides a detailed, searchable log of all AI activity on your account — combining both AI Discover and AI Create events in a single view. -
Filtering and Exporting
- Use the search bar to filter activity by user email or name
- Use the date range selector to narrow results to a specific time window
- Click the download icon to export the log
-
User vs. System Actions
You may notice two types of entries in this log: -
User actions — Triggered by a team member using AI Create (e.g., generating a study guide). These consume tokens and show 0 hours.
-
System actions — Background processes run automatically by Sardius AI Discover (e.g., Chapter Cue Generation, Video Vector Indexing, Transcript Vector Indexing). These consume hours and show 0 tokens.
EMLA Encoder Usage
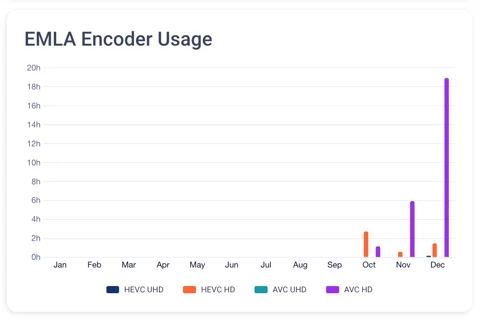
If your account uses EMLA hardware encoders, their activity is tracked here. The panel will show "No Data" if no EMLA encoder sessions have occurred in the current period.
Viewers
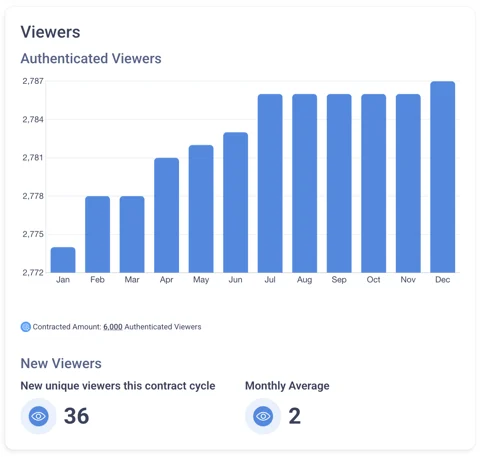
The Viewers section is split into two subsections.
Authenticated Viewers displays a line chart tracking logged-in viewer sessions across the year, giving you a sense of your audience engagement trends over time.
New Viewers surfaces two key metrics: the total number of new unique viewers acquired during the current contract cycle, and the monthly average of new viewers. These figures help you understand audience growth at a glance.
Apps
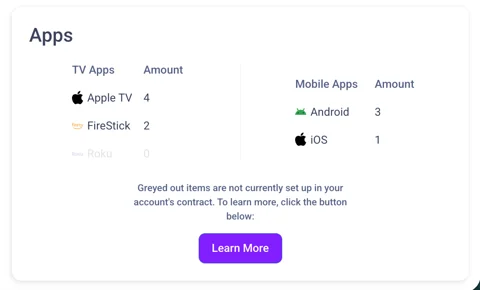
The Apps section shows which platform apps are connected to your account and how many are active per platform. Apps are split into two categories:
TV Apps
- Apple TV
- FireStick
- Roku
Mobile Apps
- Android
- iOS
Each platform displays a count of connected apps. Greyed-out platforms are not included in your current contract. To learn more about adding a platform to your plan, click Learn More.