See How Your Feed is Performing
Sardius collects viewership data from all viewers who access your content from web or mobile devices that utilize the Sardius player. While this data is collectively available from your account’s analytics, you can also see viewership statistics from assets that are collected according to a feed.
Note: Data for feeds is collected only through players utilizing the Feed ID/URL. Should an asset be attached to a feed, but viewed in a separate player (such as a direct asset link), those stats will be forwarded to this feed.
Accessing Feed Stats
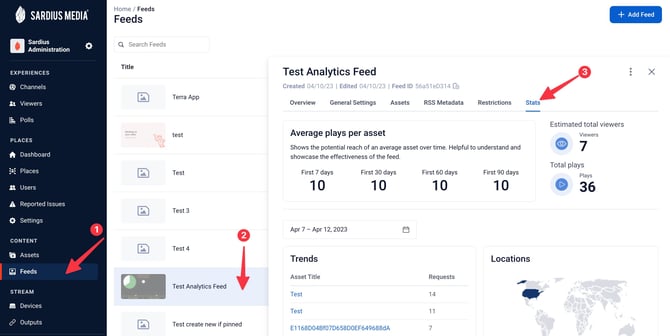
- To access your Feed’s stats, navigate to the Feeds section of the Control Panel
- Locate the Feed you wish to see stats for and click on it. Then, click on the Stats tab.

Understanding Viewership Metrics
Top Section: Stats Overview

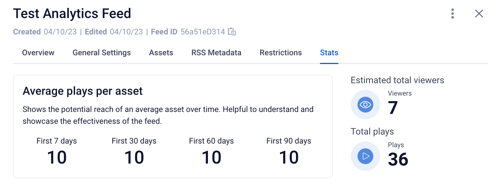
- Average plays per asset: will show the potential reach of the 3 most recent assets in the feed. This section will show averages for:
- First 7 days
- First 30 days
- First 60 days
- First 90 days
- Estimated Total Viewers: will display a total number of viewers who accessed assets through the feed.
- Total plays: will display the total number of plays for all of the assets in the feed.
Lower Section: Additional Information

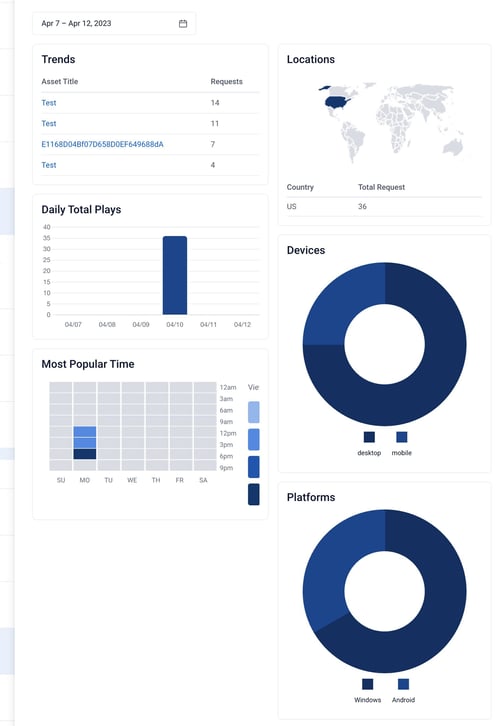
- Date Range Selector: By default, this field will populate with the last 7 days. To change this, click on the calendar icon and select a date range. All of the graphs in this section will update accordingly
- Trends: will display the most-watched assets during the selected period.
- Daily Total Plays: will display the total number of plays from your feed for each day in the selected date range.
- Locations: will display the countries where the assets from your feed were viewed in
- Most Popular Time: will display the times of the day when your feed’s assets were viewed more frequently
- Devices: will display a pie chart that presents the total number of certain devices. You can view the total number per device by hovering over that section of the pie chart.
- Platforms: will display a pie chart that breaks down the total number of platforms the feed was accessed on. You can view the total number per platform by hovering over that section of the pie chart.
